


Make Bar Chart from MySQL Table Data
In this tutorial, we will make a bar chart from MySQL table data.
JavaScript Charts, Graphs, Graphics, Circles, Ellipses, Arcs, Lines, and Polygons
Grab and Drop, Not Drag and Drop
Add Ids and onClicks to Divs
Add Ids and onClicks and Grab and Drop to Divs
Make Anti-alias (Almost) Lines
Make Anti-alias (Almost) Lines Using Bresenham's Line Algorithm
Good JavaScript Circle Algorithm
Good JavaScript Ellipse Algorithm
Good JavaScript Arc Algorithm
Make JavaScript Irregular Polygon
JavaScript Area of Irregular Polygon Algorithm
Make Line Chart from User-Inputted Data
Make Line Chart from CSV Data
Make Line Chart from MySQL Table Data
Make Bar Chart from User-Inputted Data
Make Bar Chart from CSV Data
Make Bar Chart from MySQL Table Data
Make Pie Chart from User-Inputted Data
Make Pie Chart from CSV Data
Make Pie Chart from MySQL Table Data


Data for charts and graphs can come from any number of sources. We considered putting together a user input form and the numeric data could be charted and the non-numeric data turned into labels, and we did that here: Make Bar Chart from User-Inputted Data. But we decided to also interface with the two most important database sources needing charting: CSV files and MySQL tables. CSV is a delimited data format that has fields/columns separated by the comma character and records/rows terminated by newlines, and MySQL is the most popular open-source database ever. The first, CSV, can be pulled out of any competant database app, for example: spreadsheets such as Microsoft Excel or databases such as Microsoft Access database or Apache OpenOffice, which is a spreadsheet, database, word processor, plus other stuff (and it's free). MySQL is a server-side relational database, and the tables that we store in this database can be easily created, modified, or just read with server-side computer languages—such as PHP. We'll read a CSV file here: Make Bar Chart from CSV data, but on this page we'll stick to MySQL table data. Okay, let's look at some test data we typed into phpMyAdmin:
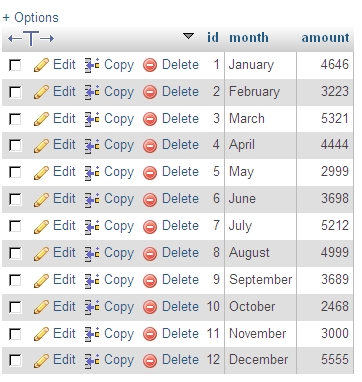
Now let's check out MySQL test data stuck into an HTML table—it's handy and compact but a graph or chart lets you see the comparative size of the values more clearly:

And you can, of course, simply import comma-separated data into MySQL if you're too lazy to type the data into phpMyAdmin, which sticks it into a MySQL table once you press Save. Plenty of apps can make lots better graphs than what we'll do here, but if you like programming as much as we do, you'd like to check out how it's done. Besides, what if you've created a PHP poll with results stored in a MySQL table, but do not feel like dealing with the script for making a chart, but you do want a bar chart or line chart?
Create the MySQL table database. And get the PHP program below called Make Charts from MySQL Table Data, which you may copy from this page and name as a PHP file called make-charts-from-mysql-table-data.php.
When creating your CSV file or Excel file that you'll export into MySQL as CSV, remember to type in a word like the name of a month and then an amount that must be a number. Don't add $ or other things—if you need it to be about money, have this in your CSV name, such as Monthly Data in Dollars Collected From Selling Pottery. If you'd like to add a $ filter so that you can deal with exported Excel data with $ in front of it, that's simple programming we'll leave up to you to add that to the PHP program below.
On to the script. First comes the include('config.php') statement. See The Configure File—it doesn't matter what you name your variables, as long as the right info is provided that lets the connection to the MySQL database succeed, and as long as the variable names after the mysql_connect() are the same as the ones before it.
After some simple CSS to style the page so it looks good, we code the aDiv and bDiv DIVs. bDiv we use for the month labels and aDiv we use for the amount labels. We'll be adding these labels to the document with DOM methods like
createElement() and appendChild(), using innerHTML for inserting the actual text into the DIV. We'll use calculated height and marginLeft properties on the DIVs later. Note that the overflow property is hidden and the background-color is transparent so in case you decide to have longer labels, the text won't slobber all over nearby text.
Next, there's a little form whose action is the PHP file make-charts-from-mysql-table-data.php, which is the name you need to give the PHP file on this page. In other words, once you type in the table name, such as makechart, the web page calls itself, reloading but remembering the POSTed file name.
Next comes the PHP script, although technically the include at the start was PHP also. We declare the $month and $amount arrays, then POST in the table name and check to see if there is such a table in your MySQL database on the server. Next comes the MySQL query "SHOW TABLES LIKE '$table'", which checks whether or not the table exists. Now we use the mysql_num_rows() Function. This function counts the number of table rows to be greater than zero if the table exists and has one or more rows, otherwise it gives the JavaScript message "No such table." and the page reloads. If the table is there and has data, the script goes on to load the table contents into a resultset $sql. We use a while() loop with the PHP function mysql_fetch_array() to get the table data into rows.
While in the loop, we use the array_push() function to get the MySQL table data into our two arrays. Then, in order to know how to arrange the
web page, we need to know the maximum value found in the $amount array. We use the max() function for this purpose. After closing the MySQL database, we give the JavaScript message "No such table." and the page reloads if there was no table or it was empty.
Now come JavaScript Object Notation (JSON) for PHP to JavaScript conversions. We use the json_encode() function to convert the month names array and the amount array and the biggest amount number and the CSV file name into JavaScript array and variables, respectively, for convenient use. Then we divide the maximum amount value by 350. The 350 is the height of the graph minus 30—which we did because we don't want the top of a bar in the graph to hit the top of the graph. We'll be using a[i]/r to figure out bar heights. The a[] array is where the amounts are stored.
Next we use the Document Object Model (DOM) in two for loops to add labels to the graph and graph bars as well as drawing the bars themselves. We use the createElement() Method to bring a div into existence and the appendChild() Method to get it integrated into the document. The innerHTML property is used to put the labels into the div elements.
Next we put a box around the entire bar chart. Finally, we put the MySQL Table name as a big title under the graph and we draw a box around the whole graph using a width forced by the width and min-width properties.
<?php
include('config.php');
?>
<html>
<head>
<!DOCTYPE html PUBLIC "-//W3C//DTD HTML 4.01 Transitional//EN">
<META HTTP-EQUIV="Content-Type" CONTENT="text/html; charset=windows-1252">
<TITLE>Make Charts from MySQL Table Data</TITLE>
<meta name="description" content="Make Charts from MySQL Table Data">
<meta name="keywords" content="Make Charts from MySQL Table Data,View MySQL Table Data as Charts,chart MySQL Table Data,php,javascript, dhtml, DHTML">
<STYLE TYPE="text/css">
BODY {margin-left:0; margin-right:0; margin-top:0;text-align:left;}
p, li, td {font:13px Verdana; color:black;text-align:left}
h1 {font:bold 28px Verdana; color:black;text-align:center}
h2 {font:bold 24px Verdana;text-align:center}
h3 {font:bold 15px Verdana;}
#myid {position:absolute;left:10px;top:117px;height:380px;border: solid 1px #000;}
#myform {position:absolute;left:50px;top:20px}
#label {position:absolute;left:400px;top:550px;}
.aDiv {
width: 68px;
border: solid 1px #000;
background-color: #e1e1e1;
font-size: 11px;
font-family: verdana;
color: #000;
padding: 5px;
overflow:hidden
}
.bDiv {
width: 68px;
border: none;
background-color: #fff;
font-size: 11px;
font-family: verdana;
color: #000;
padding: 5px;
overflow:hidden
}
</STYLE>
</head>
<body>
<div id='myform'>
<center><h1>Make Charts from MySQL Table Data</h1></center>
<form action='make-charts-from-mysql-table-data.php' method='post' name='sendname'>
<center><input type='text' name='table' id='whattable' size='35' maxlength='40' value=''>
<input type='submit' value='Get chart data' name='flag'></center></form></div>
<?php
$month=array();$amount=array();
$table=$_POST['table'];$t=$table;
if(strlen($table) > 0){
$exists = mysql_query("SHOW TABLES LIKE '$table'") or die(mysql_error());
$num_rows = mysql_num_rows($exists);
if($num_rows>0){
$sql=mysql_query("SELECT * FROM $table");
if(mysql_num_rows($sql)>0){
unset($table);
while($row = mysql_fetch_array($sql)){
$m=htmlentities(stripslashes($row['month']), ENT_QUOTES);
$a=htmlentities(stripslashes($row['amount']), ENT_QUOTES);
array_push ($amount, $a);
array_push ($month, $m);
}
$biggest=max($amount);
mysql_close();}}
else{echo '<script language="javascript">alert("No such table.");window.location="make-charts-from-mysql-table-data.php";</script>;';}
}
?>
<script language="javascript">
var m = <?php echo json_encode($month); ?>;
var a = <?php echo json_encode($amount); ?>;
var b = <?php echo json_encode($biggest); ?>;
var t = <?php echo json_encode($t); ?>;
var r=b/350;
if (a.length > 0 && m.length > 0) {
for (var i=0;i<a.length;i++){
var divTag = document.createElement("div");
divTag.id="a" + i;
divTag.setAttribute("align", "center");
divTag.style.marginLeft = (i*78+20)+"px";
divTag.style.position = "absolute";
divTag.style.bottom = 100+"px";
divTag.style.height = (a[i]/r)+"px";
divTag.className = "aDiv";
divTag.innerHTML = a[i];
document.body.appendChild(divTag);
}
for (var i=0;i<a.length;i++){
var divTag = document.createElement("div");
divTag.id="b" + i;
divTag.setAttribute("align", "center");
divTag.style.marginLeft = (i*78+20)+"px";
divTag.style.position = "absolute";
divTag.style.bottom = 70+"px";
divTag.style.height = 30+"px";
divTag.className = "bDiv";
divTag.innerHTML = m[i];
document.body.appendChild(divTag);
}
document.write("<div id='label'><h1>"+t+"</h1></div><div id='myid' style='min-width:"+(a.length*80)+"px; width:"+(a.length*80)+"px'> </div>");
}
</script>
</body>
</html>